
| 前页 | 后页 |
使用仿真定义图表
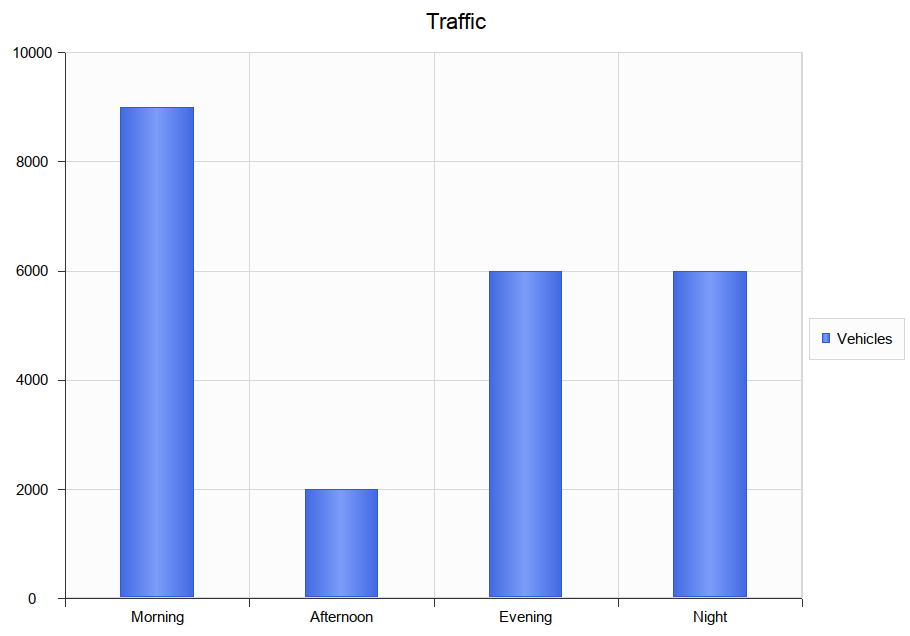
模拟是观察行为的绝佳工具。在仿真中的任何时候,都很容易分辨出我们的位置和状态。在进行仿真时,通常会丢弃此信息。在一个模拟中,向我们显示了24小时内的交通量,我们可以很容易地观察到早上和晚上各个小时通过隧道的车辆数量。在模拟完成后保留此信息,并使用它来提供有意义的信息可能会很有用。 Simulation中的DynamicChart功能使我们能够做到这一点。以上面的示例为例,我们可以记录模拟过程中每个步骤的流量,并使用它生成一个图表,该图表可以清楚地显示出在24小时的模拟过程中通过隧道的流量。图表实际上可以为我们显示模拟的时间轴或一个的总和。
在仿真中生成自定义图表
You can fashion all sorts of Charts from any simulation. Each time a simulation is run, any DynamicChart elements referenced (by name) by the simulation are updated. The simulation will search for any named Chart in the same Package as the model.
Follow this simple process:
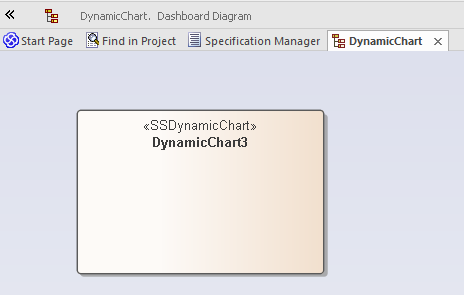
- Create a DynamicChart element for the simulation.
- In the initial step of the Simulation, use JavaScript to define a variable to hold the vehicle numbers.
//
// the traffic variable will hold the traffic numbers as simulation proceeds and is initially zero
// each element of the array represents a period of the day, morning, afternoon, evening and night.
//
var traffic = [0,0,0,0]; - Next write the JavaScript that describes, in JSON format, the Chart to produce.
//
// The JSON instance describing the chart to produce. (complies with the EA DynamicChart Schema)
//
var chartData =
{
"Category" : "Column",
"Type" : "Simple",
"Title" : "Traffic",
"Series" :
[
{ "Label" : "Vehicles",
"Data" :
{
"Type" : "Column",
"Points" :
[
{ "Category": "Morning", "Y" : 0 }, // The Y values of the axis are initially zero
{ "Category": "Afternoon", "Y" : 0 }, // they will be filled in at end of simulation
{ "Category": "Evening", "Y" : 0 },
{ "Category": "Night", "Y" : 0 }
]
}
}
]
}; - At various transitions in the simulation update the traffic numbers.
//
// 2000 vehicles went through the tunnel in the afternoon (element 1)
//
traffic[1] += 2000; - At the end of the simulation, use the data captured during the run to fill the series.
// fill points in series with the number of vehicles for each part of the day
var dataPoints = chartData.Series[0].Data.Points;
for(var dp = 0; dp < traffic.length; dp++)
{
dataPoints[dp].Y = traffic[dp];
} - Update the model.
// Call the EA function to populate the DynamicChart element named 'Vehicles' with this data.
sim.GenerateChart( "Vehicles", JSON.stringify(chartData));
仿真产生的默认图表
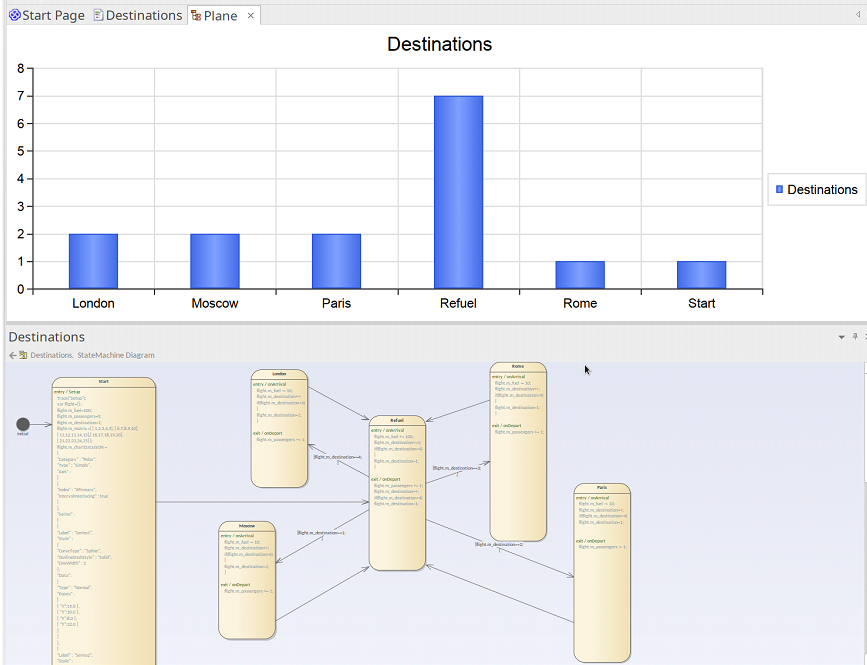
除了您专门制作的图表外,还可以通过模拟自动生成摘要图表。所需要做的只是在包中添加DynamicChart工件,并为其赋予与StateMachine相同的名称。默认的图表总结了在执行模拟过程中进行的状态转换。如果模拟完成时找到默认图表,则该图表的数据将更新并自动显示。
要将默认图表添加到您的StateMachine仿真中,请按照下列步骤操作:
- 找到包含要在其上执行模拟的StateMachine的程序包。
- 创建仪表板图作为该包的子级。
- 将DynamicChart Artifact添加到Dashboard图中,并为其指定与StateMachine相同的名称。